情報を分かりやすくクリエイティブな図で表した例25種類
情報を分かりやすくクリエイティブな図で表した例25種類です。
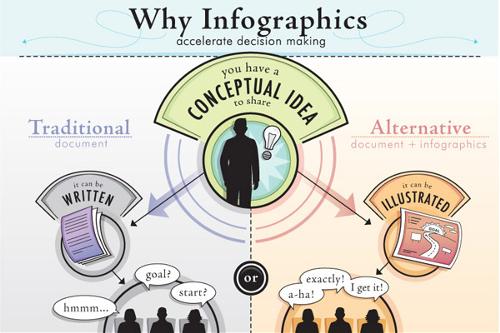
1. Why Infographics
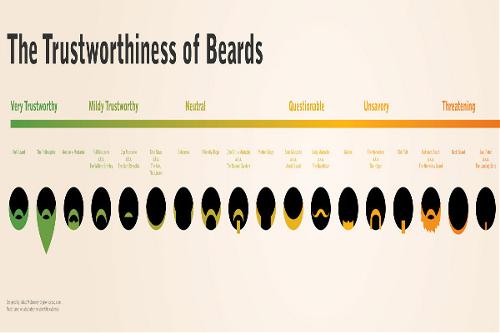
2. The Trustworthiness of Beards
3. Carland
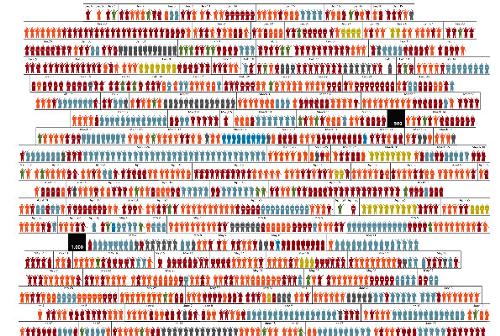
4. Iraq War
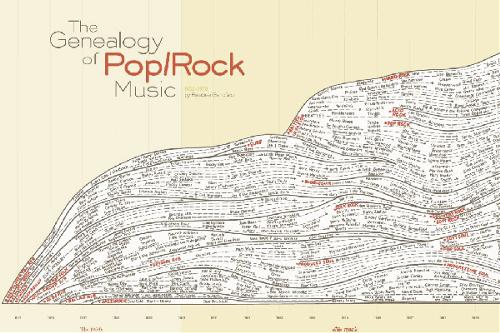
5. The Genealogy of Pop/Rock Music
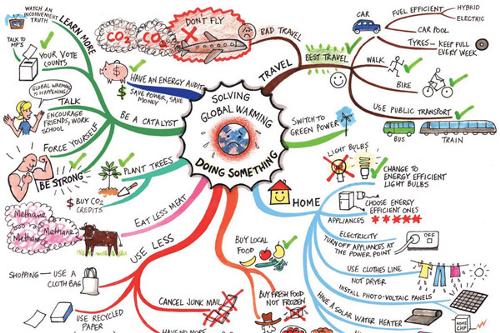
6. Solving Global Warming
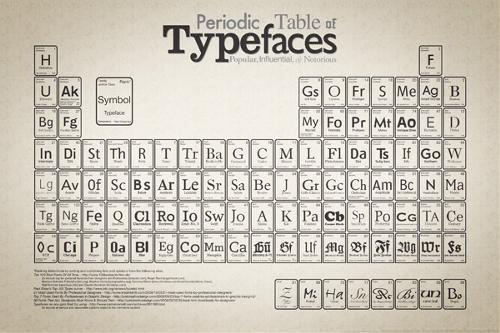
7. Periodic Table of Typefaces
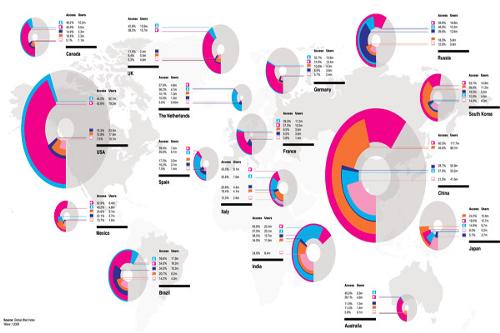
8. The State of the Internet
JESS3 / The State of The Internet from JESS3 on Vimeo.
9. Social Web Involvement
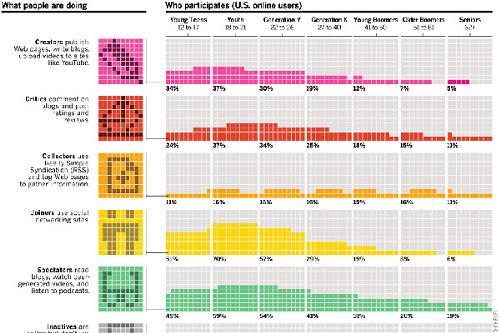
10. What People are Doing
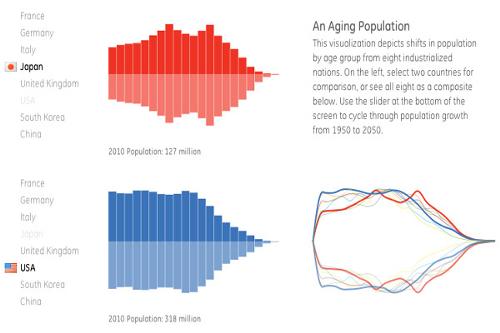
11. Our Aging World
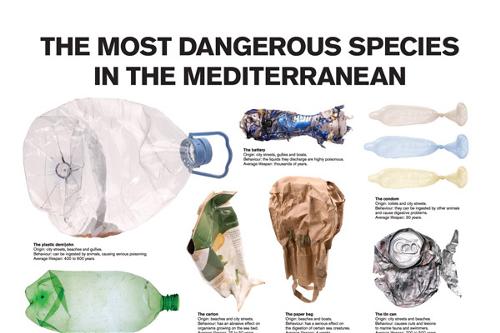
12. The Most Dangerous Species in the Mediterranean
13. Data Protection Has Changed
14. Coalition of the Willing
Coalition Of The Willing from coalitionfilm on Vimeo.
15. Influences Map
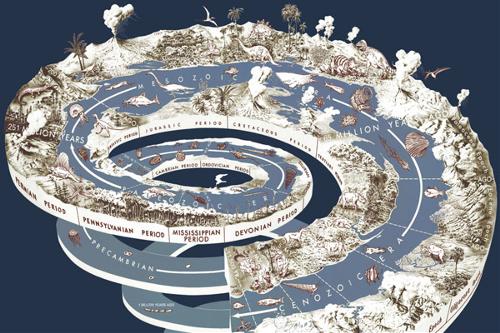
16. Geological Time Spiral
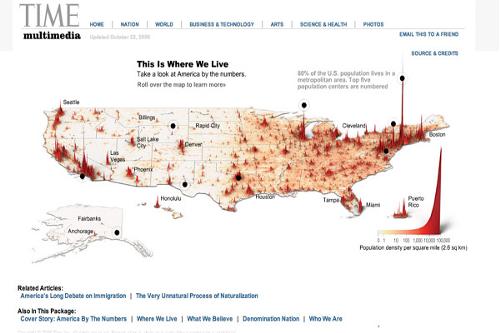
17. Where We Live
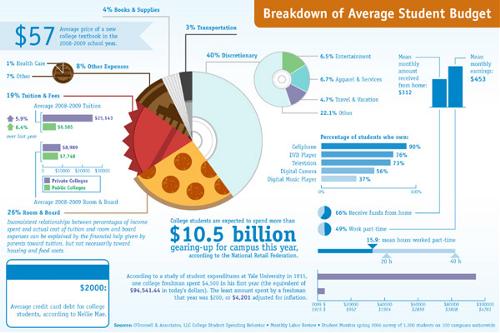
18. Student Budget
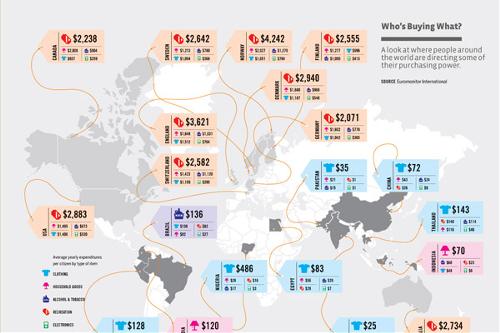
19. Who’s Buying What
20. A Day in the Life of NYTimes.com
The New York Times site traffic, US, June 25, 2009 from Nick Bilton on Vimeo.
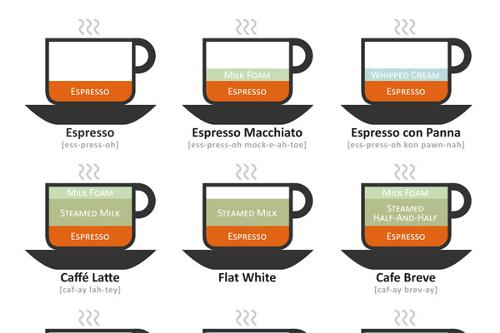
21. Coffee Drinks Illustrated
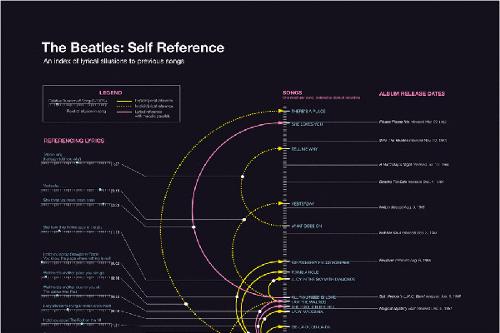
22. The Beatles: Working Schedule
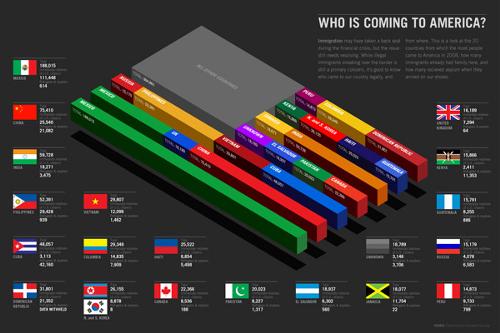
23. Who Is Coming to America?
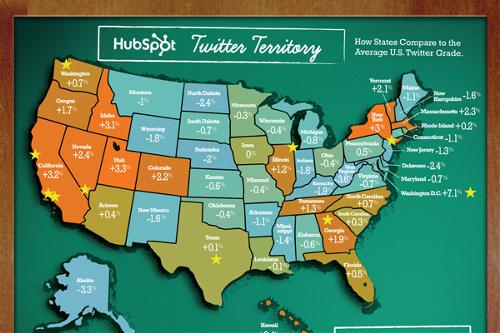
24. Twitter Territory
25. Follow the Money
A Roundup of 25 Jaw-Dropping Infographics A Roundup of 25 Jaw-Dropping Infographics




あなたのコメントが一番最初です!